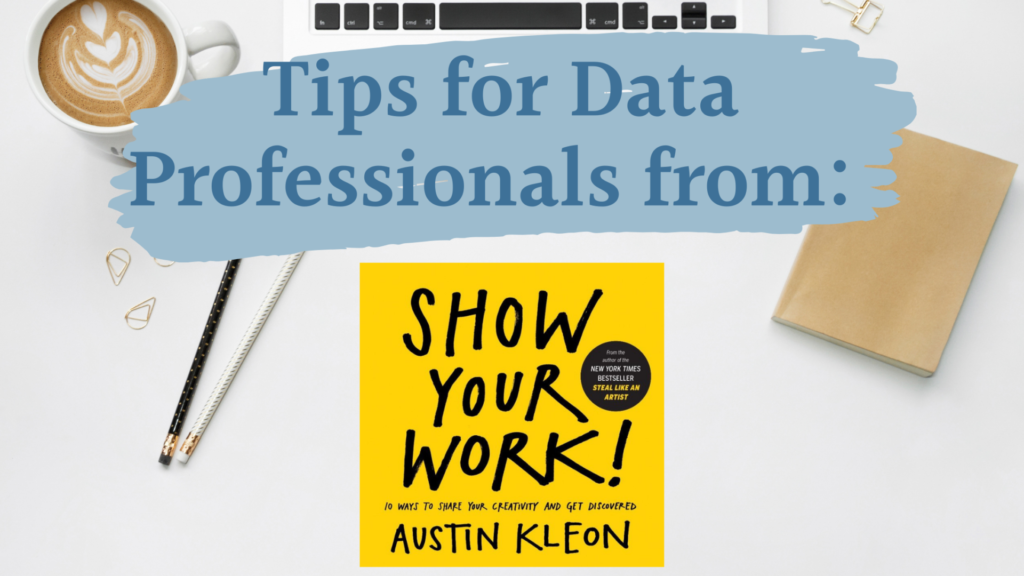
Data Visualization

Blog banner with blog title Beware of Summary Statistics

Beware of Summary Statistics

Summary Statistics One of the first things I learned when taking my first statistical programming course was how to calculate summary statistics.  Summary statistics are used to summarize the distribution of data. Depending on the type of data, the stats used to summarize can vary but examples may include the average, the median, the coefficient

Beware of Summary Statistics Read More »

Blog banner with title "Accessibility Concerns with Clubhouse and talking about dat viz"

Accessibility Issues with Clubhouse and Talking about Data Viz

Lately, I’ve been thinking more about making accessible data visualizations while also exploring and using the newest audio-only social media app called Clubhouse. While using this app, I’ve come across a few accessibility concerns and limitations with using this app.  What’s the benefit of using Clubhouse to talk about topics like this? First, let’s talk

Accessibility Issues with Clubhouse and Talking about Data Viz Read More »