
Titles aren’t exactly the first thing you think of when optimizing your data visualization.
Yet, titles are almost ALWAYS the first or second thing people see. And for good reasons:
- Titles are larger in size and formatted differently
- They are optimally placed towards the top left where our eyes tend to go first anyways.
So it only makes sense that we should take full advantage of this opportunity and strategically choose our titles. Here are a couple of things you can use titles for that we’ll cover in this post:
- Highlight a key insight
- Call the audience to action
Highlight the Insight
In her book, Storytelling with Data, Cole Nussbaumer Knaflic gives a great example to demonstrate how titles can be used to highlight the insight you want your audience to take away from your viz.
Compare the title of “2015 Budget” with “Estimated 2015 spending is above budget”. The first version is how most people end up titling their charts. But the second version succinctly highlights an insight that the audience would care about the most. Like a CFO who wants to know about how this year’s spending compared to the allocated budget would really appreciate the second title. It goes straight to the good stuff!
Your audience will appreciate your visuals more if you make it easier to highlight insights for them. Doing so in your title is one way to do so quickly and efficiently.
Have Your Titles Call to Action
Another strategy you can use with your titles is have it be a call to action. Particularly if you want your audience to act in a certain way.
Here’s another example from Storytelling with Data that demonstrates this in action:
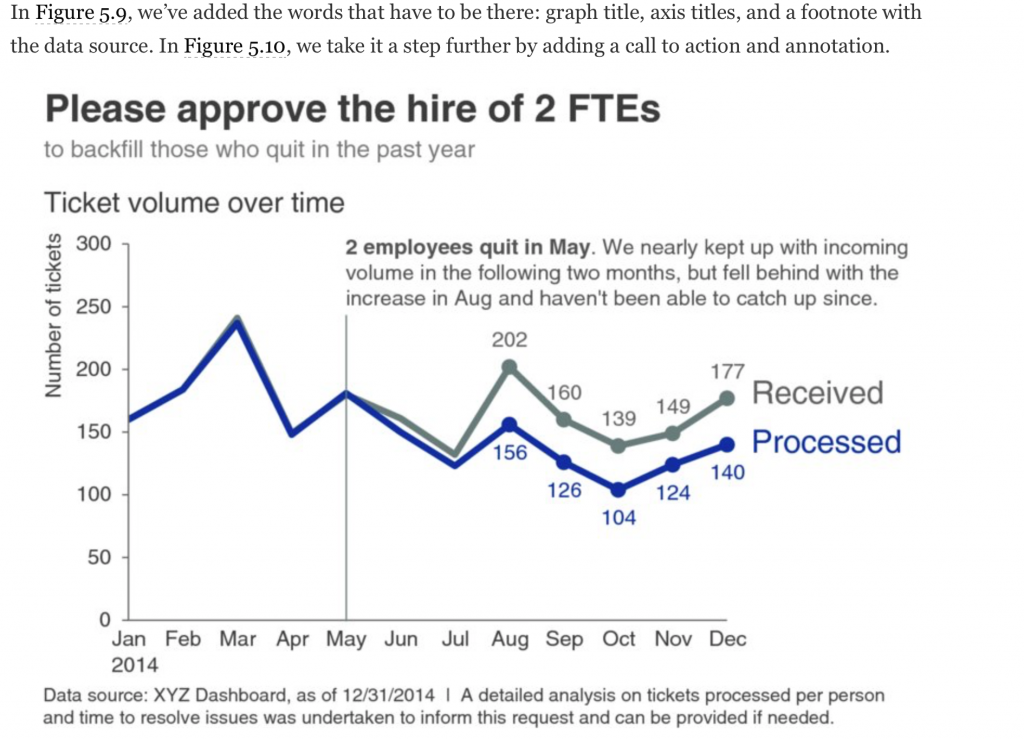
Notice how the viz itself and the accompanying text annotations all support the call to action. The text points out when 2 employees quit to explain the gap in ticket processing. Not doing so would have left the burden on the viewers to guess what changed in May to cause this.
So, as you can see, choosing the right title can serve as a call to action while your viz shows the evidence to back it up.
Optimizing Visualization Titles for Exploratory Data Analysis
For exploratory analysis, some experts caution about injecting your own insights into the viz or texts. This allows other to explore the data on their own and contribute with their own perspectives without being biased by yours.
So for exploratory visuals, it’s fine to keep the title descriptive like “2015 Sales by Product Category”.
To learn more about the differences between exploratory and explanatory visualizations, check out this blog we previously published.
Keep Your Intended Audience in Mind
As always, think about your audience. What do they care about the most? What do YOU want them to focus on? I highly recommend using the Call to Action style for your title if you want your audience to take a certain action.
As you can see, the options for optimizing data visualization aren’t limited to the actual visual itself. Enhancing the titles of your visualizations is another way to get the message across to your audience.
In next week’s topic, we’ll cover how to use Gestalt principles for data visualizations.
Also my mini-course, Data Viz Like a Boss, is having a limited time deal! It’s a bundle of courses and resources to take your data viz to the next level!