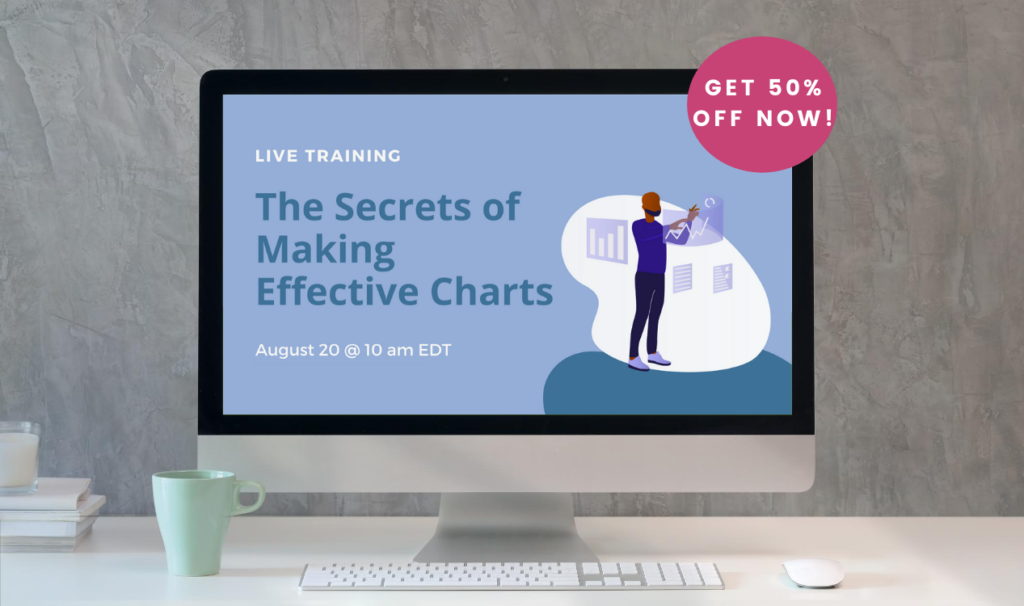
In this 1-hour LIVE training quickly learn how to create effective charts to convey your business-critical insights to your audience.
The Secrets of Making Effective Charts
LIVE on August 20th at 10 a.m. EDT (Eastern Daylight Time)
Data visualization is an effective tool for communicating data insights to your audience…but only when done correctly.
I’m offering this training to share my easy and effective process to pick and create charts for your reports, websites, presentations that will win your audience.
With this training:
- You’ll have a process you can follow to start creating charts right away
- You’ll know exactly what options you have when it comes to picking and creating charts that are right for your message and audience
- You’ll understand and be able to implement best practices when it comes to designing your charts
- You’ll feel confident about presenting and sharing your data visualizations with others
Never stress about making charts again, join the live training!
What we'll cover
I will teach you how to choose and create an effective chart so you can grab your audience’s attention and effectively communicate your findings to them.
Here’s what my proven process will teach you:
- How to pick the chart(s) that will work for your particular topic/message/insight
- How to deliberately and strategically choose colors to be aesthetically pleasing while also focusing your audience’s attention
- Learn the best practices of creating charts like a pro (heck, not even all data professionals know these!)
Get all this for $30 $15!
This 50% off discount is only available until the live training. After that, the recorded training will be sold at $50 (live training attendees get the recording for free).

Hi, I’m Hana!
I’m a Data Visualization Specialist that helps professionals become confident data visualizers, storytellers and public speakers. I have 7 years of experience working as a data analyst after starting in academia and then shifting to work for a Fortune 5 company. I’ve had success in presenting analytical insights in both worlds of academia and industry by creating informative data visualizations and perfecting my data narratives.
My main motivation is to help people like you become better presenters of analytical findings through actionable visualizations presented in a strategic way to grab your audience’s attention and motivate them to act.
Why bother learning this?
I’ve sat through a lot of meetings and presentations and very few have captured my interest, kept me engaged, or even explained why I should care about what they’re presenting about.
Plus, showing tables or a bunch of numbers are ineffective ways to convey information —our brains just don’t work that way. We need to use data visualizations to help show our insights to our audience.
If you really want to get your audience —whether it be your clients, your stakeholders, or your boss —to start paying attention to what you’re trying to show them with your data…then this live training is for you!
This is for you if:
- You have to create reports, presentations or publish web pages with data, metrics or insights
- Work with data
- Don’t know how to use a data visualization tool yet but plan on creating charts in the near future
- Already know how to use a data visualization tool but want to learn how to make them effectively, following data visualization best practices
This is not:
- A training that will teach you how to use a specific data visualization tool like Excel.
- A presentation or report prep training (but stay tuned…I’m releasing a course soon for this!)
- Also, if you already learned visual analytics and data viz best practices, this training is likely not for you.
What previous students have to say...

How this live training will work:
- As soon as you sign up, you’ll be emailed a link to join the live training on August 20th at 10 a.m. Eastern Daylight Time.
- The training will last 60 minutes, including Q&A.
- You’ll have the opportunity to submit questions before the live training so that I can address them on the call.
- The live training will be recorded and sent to you so you have lifetime access to the replay.
Frequently Asked Questions
Everyone that registers will automatically get a recorded video of the live training for free.
Refunds will be offered up until 24 hours before the live training.
This training is applicable to visualizations made by any data visualization tool.
You do not need prior training or skills in data visualization. This training will teach you the concepts you can use with any data visualization tools, even if you’ve never made one before.
Your results from this training may vary from other prior students and attendees. Your results will be based on many variables, such as your level of effort, data viz acumen, personal qualities, knowledge, skills, practice and a host of other variables. We cannot guarantee your success, results, promotions, revenues, nor are we responsible for your success or failure. But if you implement, and constantly use what you learn you should see a difference.
All material is copyright Trending Analytics™

